9 Factorial Between-Subjects ANOVA
Factorial ANOVAs are used when you have more than one independent/predictor variables, and you are interested in whether there is an interaction between the two independent variables. In other words, you want to know if the effect of one independent variable on the dependent variable changes at the different levels of a second independent variable. Factorial ANOVAs are often called [Number]-Way ANOVAs, where the number is how many independent variables are in the analysis. For example, if we had two nominal independent variables, we would call that a Two-Way ANOVA. This chapter will focus on Two-Way ANOVAs, as they are the most common.
Between-Subjects Two-Way ANOVAs are used when you have
- 2 nominal independent/predictor variable
- Between-subjects design (participants complete only one level of each independent/predictor variable)
- A continuous dependent/outcome variable.
In this section, we will be working with a new dataset. Researchers were interested in whether connecting with strangers can improve well-being[1]. Strangers in close proximity often ignore each other, which might suggest solitude is a more positive experience than interacting with strangers. However, decades of psychology research has found that feeling socially connected increases happiness. One possibility is that people mistakenly believe that interacting with strangers will be a negative experience and, therefore, avoid it. To test this research question, the investigators designed a study where participants either imagined interacting with a stranger (or being solitary) to measure their expectations for such interactions or were instructed to actually interact with a stranger (or remain solitary) to measure their actual reactions to stranger interactions. The researchers recruited commuters waiting on the platform of a regional commuter train. In the actual experience condition, participants were randomly assigned to one of two instruction conditions: connection or solitude. Participants in the actual experience connection condition were told:
Please have a conversation with a new person on the train today. Try to make a connection. Find out something interesting about him or her and tell them something about you. The longer the conversation, the better. Your goal is to try to get to know your community neighbor this morning.
Participants in the actual experience solitude condition were told:
Please keep to yourself and enjoy your solitude on the train today. Take this time to sit alone with your thoughts. Your goal is to focus on yourself and the day ahead of you.
Participants were then contacted later that day to complete a short measure of well-being.
In the imagined experience condition, commuters were approached and asked to complete a survey. The experimental survey described the procedure of the actual experience condition and asked participants to imagine following the instructions. Participants were randomly assigned to one of the two instruction conditions. Participants in the imagined experience connection condition read:
We would like you to imagine that you are participating in a study about commuting on the train. Imagine that, as you walk to the platform to catch your train in the morning, you see a student standing near the platform who asks you to participate in a study. Imagine that, just like you did today, you agree to participate and sign a consent form. Imagine that the student gives you these instructions for the study: “Please have a conversation with a new person on the train today. Try to make a connection. Find out something interesting about him or her and tell them something about you. The longer the conversation, the better. Your goal is to try to get to know your community neighbor this morning.” Imagine that you follow these instructions and then complete a questionnaire at the end of your commute.
Participants in the imagined experience solitude condition read the same excerpt, except the instructions were changed to match the actual instructions given in the solitude condition. Following the instructions for each condition, participants predicted their well-being.
The dataset for this experiment is below. The dataset includes three variables:
- Experience: actual, imagined
- Instructions: connection, solitude
- Wellbeing: the participants’ mean score on the well-being measure
Download the dataset:
9.1 Computing a Between-Subjects Two-Way ANOVA
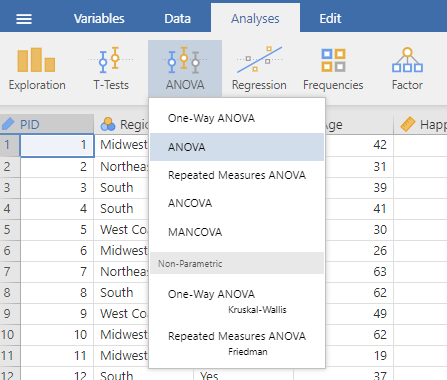
To compute a between-subjects two-way ANOVA, use the ANOVA menu: Analysis tab → ANOVA → ANOVA.
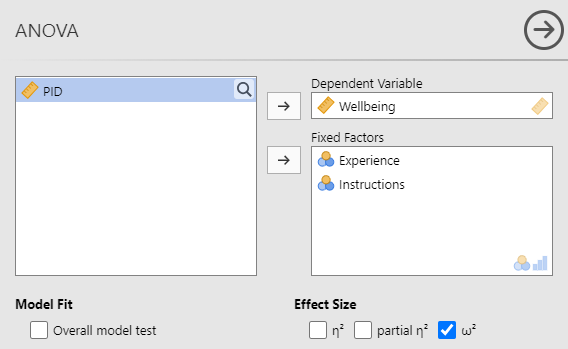
Add the continuous dependent variable you are interested in to the Dependent Variable window. Add the nominal independent variables to the Fixed Factors window. Under Effect Size, select ω2 (omega-squared).
These options produce the results tables below:
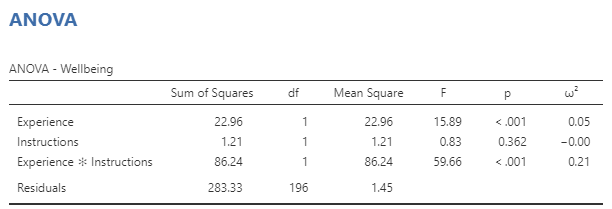
How to interpret the ANOVA table:
- Line 1 tells you the main effect of experience, is there an effect of whether people actually engaged in the experience or only imagined it on well-being (averaging across the experience instructions)
- Line 2 tells you the main effect of instructions, is there an effect of interacting with a stranger versus being solitary on well-being (averaging across whether the participants actually followed the instruction or imagined doing so)
- Line 3 tells you whether there was an interaction, i.e., did the effect of one variable depend on the second variable?
- Line 4 quantifies the residuals, the variance due to error. Use the df as the second df in your F statements.
If a main effect is significant and your independent variable has two levels, then you just need to look at the means to see which group scored higher. See section 4.4 Descriptives by Group above for how to get the means and the standard deviations you will need for reporting the results in APA style. If a main effect is significant and your independent variable has more than two levels, then you will need to conduct Post-Hoc Tests to determine which levels are different from each other. Post-hoc tests for a significant main effect with more than two levels uses the same steps as section 8.1.2 Follow Up a Significant Independent One-Way ANOVA.
If the interaction is significant, we need to do post-hoc tests to determine the pattern of effects.
9.2 Follow Up a Significant Interaction in Two-Way ANOVA
If your interaction term is significant, you will need to conduct follow-up tests.
First, we need to decide how we are going to follow up the interaction
- The effect of the actual vs imagined experience for people in the connection condition and the effect of the real vs imagined experience for people in the solitary condition
OR
- The effect of connection vs solitary instructions for people who actually engaged in the experience and the effect of connection vs solitary instructions for people who imagined the experience
Which direction you choose to follow up the interaction should be based on your hypothesis. In this example, the researchers hypothesized that when people imagined the different experiences, people would predict low well-being after connecting with a stranger compared to being solitary. In contrast, when people actually engaged in the experiences, participants would report higher well-being after connecting with a stranger compared to remaining solitary. This hypothesis suggests we should follow up the interaction by looking at 1) the effect of connection vs. solitary instructions for people who actually engaged in the experience and 2) the effect of connection vs. solitary instructions for people who imagined the experience.
In the ANOVA menu, select the sub-menu Post Hoc Tests.
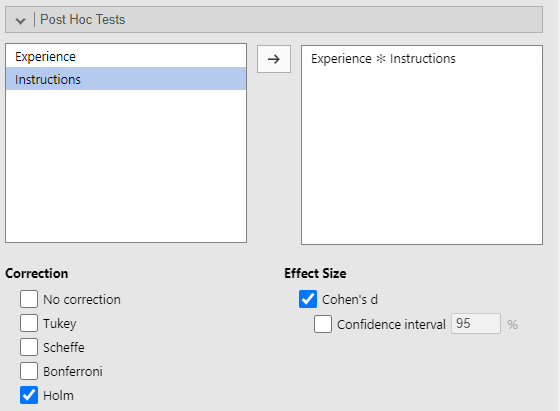
Move “Experience ✻ Instructions” to the right window. Under Correction, uncheck Tukey (default) and select Holm. Under Effect Size, select Cohen’s d. These options will add a new table to your ANOVA results:
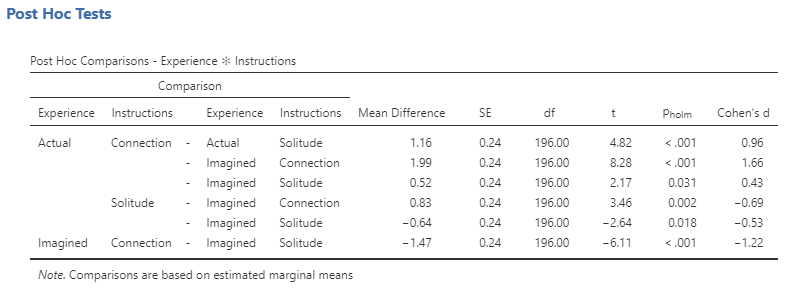
Whoa! I thought you said we only need two comparisons! We do, but jamovi by default gives all pairwise comparisons, even ones that do not make sense to compare. Students who are new to jamovi also commonly find it difficult to interpret what comparison each line represents since there are several blanks on the left end of the table. If a spot is blank, it means the label above it should be used. Here is a version of the table with the blanks “filled in” and with line numbers for easy reference:
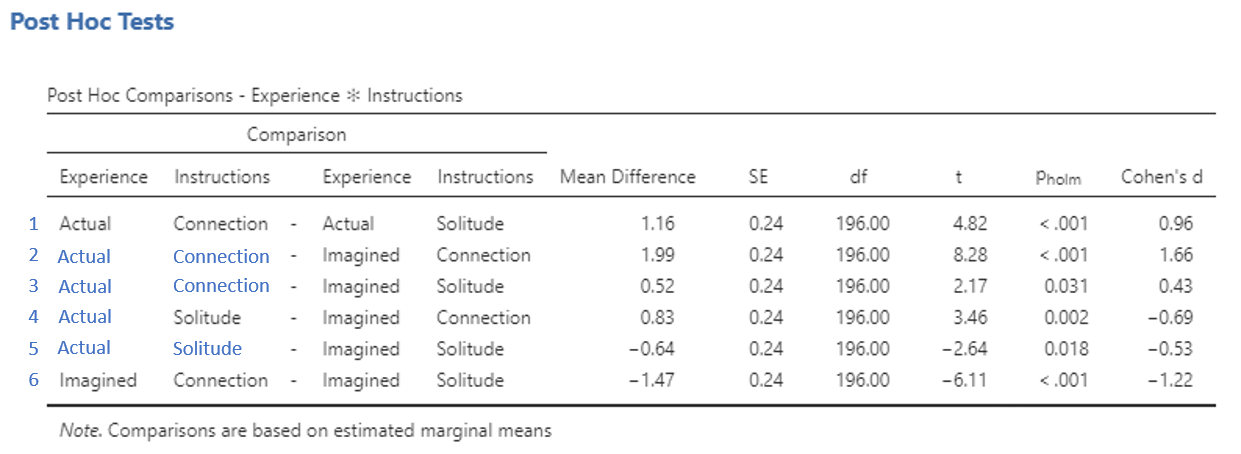
Based on our hypothesis, we need two comparisons:
- The effect of connection vs solitary instructions for people who actually engaged in the experience. In the table: Actual Connection – Actual Solitude (Line 1)
- The effect of connection vs solitary instructions for people who imagined the experience. In the table: Imagined Connection – Imagined Solitude (Line 6)
9.3 Computing Means & Standard Deviations for Two-Way ANOVA
To get the means and standard deviations for both the main effect and interactions we will need to use the Descriptives option three times. See section 4.4 Descriptives by Group.
For this example, we will need:
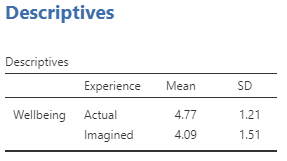
- Well-being split by Experience
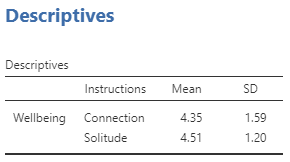
- Well-being split by Instructions
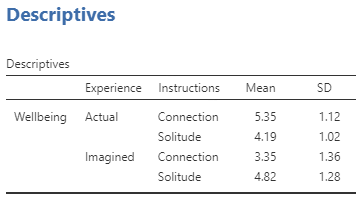
- Well-being split by Experience AND Instructions. I.e., move both the Experience and Instructions variables to the Split by window
9.4 Reporting Between-Subject Two-way ANOVA
To investigate the impact of connection with strangers versus solitude and whether people actually engaged in the experience or imagined it on well-being, we conducted a 2(Experience: actual, imagined) by 2(Instructions: connection, solitude) between-subjects analysis of variance (ANOVA). The omnibus ANOVA revealed a significant main effect for whether participants actually engaged in the experience or not, F(1, 196) = 15.89, p < .001, ω2 = .05, such that people reported higher well-being when they engaged in the experience (M = 4.77, SD = 1.21) compared to participants that predicted their well-being after imagining the experience, (M = 4.51, SD = 1.20). The main effect of instruction type was non-significant, F(1, 196) = 0.83, p = .36, ω2 = .00, there was no difference in well-being for those that connected with strangers (M = 4.35, SD = 1.59) compared to participants that were instructed to remain solitary (M = 4.51, SD = 1.20).
The omnibus ANOVA also revealed a significant experience type by connection instructions interaction, F(1, 196) = 59.66, p < .001, ω2 = .21. We followed up the interaction by conducting post-hoc tests (using the Holm correction) of the effect of connection instructions for people who imagined the experience and the effect of connection instructions for people who actually engaged in the experience. The post-hoc tests indicated that when people imagined the experience, those who were instructed to connect with a stranger predicted they would have lower well-being (M = 3.35, SD = 1.36) compared to those instructed to remain solitary (M = 4.82, SD = 1.28), t(196) = −6.11, pholm < .001, Cohen’s d = −1.22. In contrast, when people actually engaged in the experience they reported higher well-being after connecting with a stranger (M = 5.35, SD = 1.12) compared to remaining solitary (M = 4.19, SD = 1.02), t(196) = 4.82, pholm < .001, Cohen’s d = 0.96.
Important Notes for Reporting Results
- Start by explaining the model you will be testing.
- Report the dependent variable mean and standard deviation for each group (level of the independent variable) in parentheses after you mention the group once (the first time the group is mentioned).
- For the F statement, in the parentheses put the degree of freedom (df) from the ANOVA table line with the independent variable first and the df from the line with the Residuals second.
- If a main effect or post-hoc test is significant, indicate which group was higher/lower on the dependent variable.
- Don’t forget the dependent variable and the comparison group! When people actually engaged in the experience they reported higher well-being after connecting with a stranger compared to remaining solitary. Make sure to describe the dependent variable and levels of the independent variable rather than using the variable name and level labels from jamovi.
- Make sure to include the effect size. For the main effects and interaction, report ω2. For the post-hoc tests, report Cohen’s d.
- For notes on formatting statistical statements, see Appendix Reporting Statistics in APA style.
- This example was based on Epley & Schroeder (2014) ↵
