2 Jamovi Basics
2.1 Download Jamovi
Jamovi can be downloaded for free from Jamovi’s website. This guide was created using jamovi 2.5.6.
2.2 Getting Started
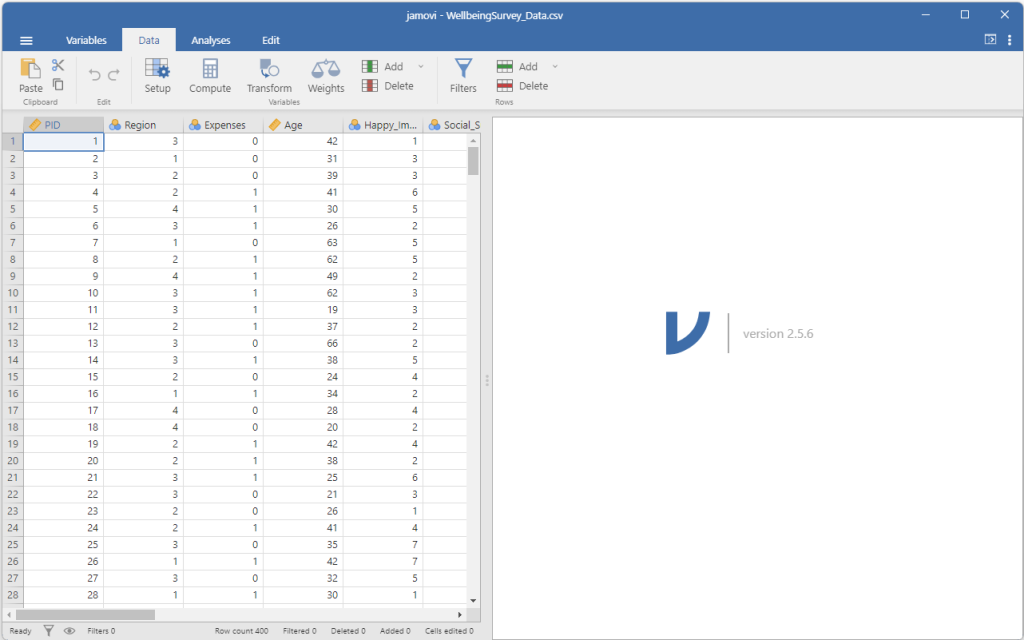
When you first open jamovi, you will be presented with a user interface that looks like this:
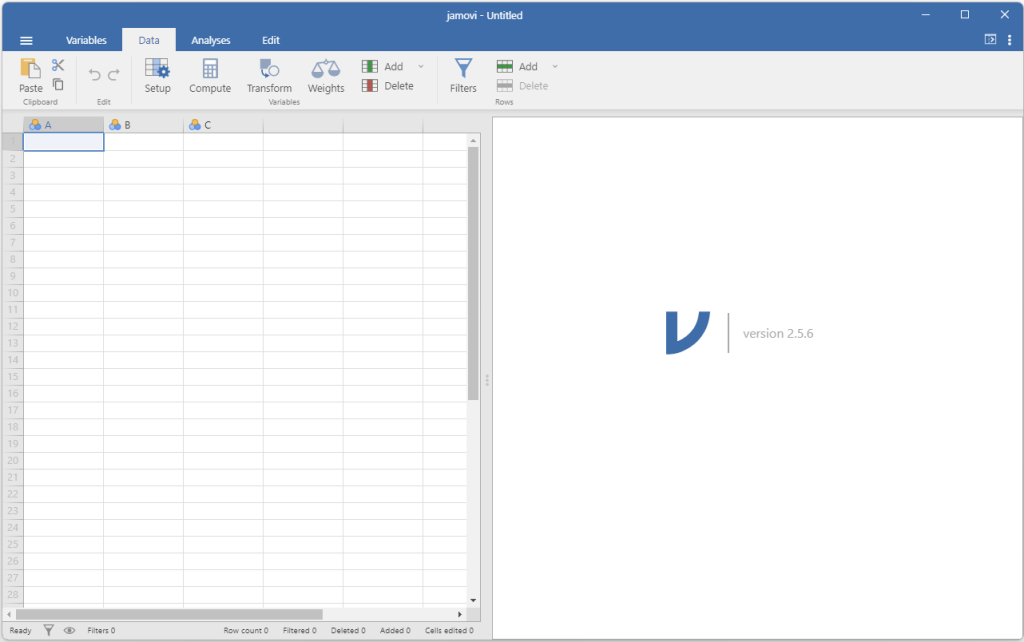
On the left is the spreadsheet view where the data will appear. On the right is where the results of statistical analyses appear.
You can enter data directly into the jamovi spreadsheet, or if you already have the data in another data file format, you can open that file in jamovi. Jamovi supports a wide range of file types, including CSV, XLSX, SPSS, Stata, SAS, and more.
2.3 Opening Data in Jamovi
To open an existing dataset, click on the three lines in the upper left-hand corner ![]()
Next, select Open, then navigate to where you have the file saved. If your file directory does not automatically open in the open panel, select Browse and navigate to the correct location using your computer’s file navigation.
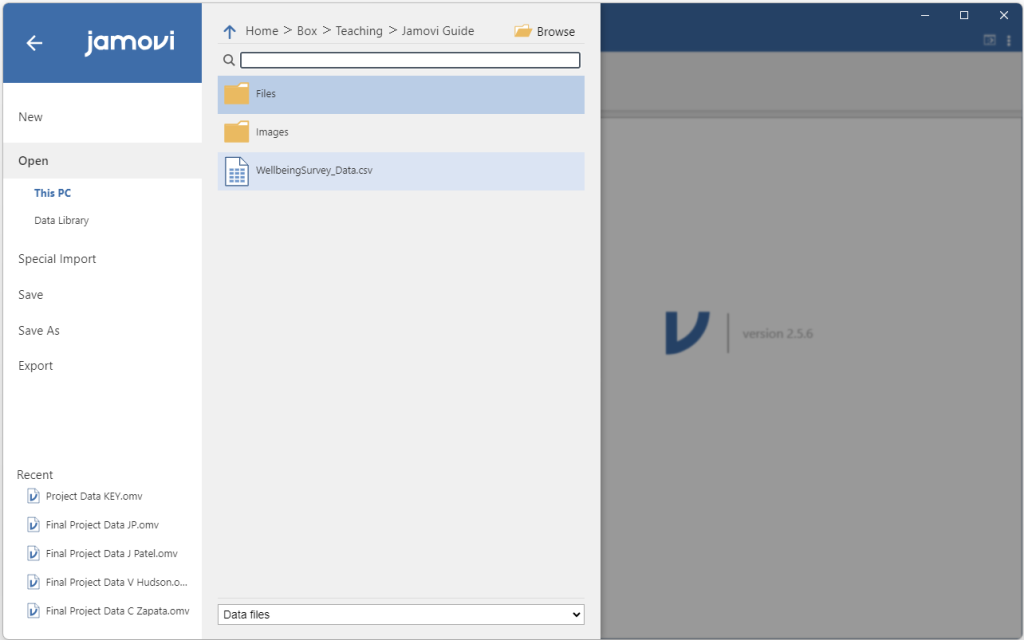
Note. When opening an existing dataset, use the Open option, not the Special Import option. The special import option is used for combining datasets and, if used, will append your data to the existing empty data columns. As a result, your dataset will have empty variables if you use the special import option.
2.4 Opening Jamovi Files in Windows versus Mac
Once you have a saved jamovi file, you can open it on a Windows computer by simply double-clicking it like any other file. However, if you are using a Mac, the operating system will often not recognize the file type, and you will get an error message. To open an existing jamovi file on a Mac, first open the jamovi program, then use the steps outlined above using the open menu.
2.5 Jamovi Settings
In the upper right-hand of the menu ribbon, there are three dots ![]() that indicate the settings menu.
that indicate the settings menu.
2.5.1 Recommended Changes
I recommend two settings under the Results section of the settings menu:
- Number format: 2 dp.
- P-value format: 3 dp
With these settings, numbers in your analyses (other than p-values) will be presented with two decimal places, which is consistent with APA style. P-values will be presented with three decimal places. Later in this text, we will discuss when you should report p-values with two decimal places versus three decimal places. See Quick Reference: Reporting Statistics in APA Style.
2.5.2 Other Changes
Also under Results, you can select “Syntax Mode” to make the underlying R code visible. This code works with the jamovi package in R. Learn more about jamovi and R on the jamovi R package website. Under Plots, you can also change the plot theme and the color palette.
2.6 Different View Options
When you open jamovi, there are different view options accessible via tabs at the top of the window.
2.6.1 Variables
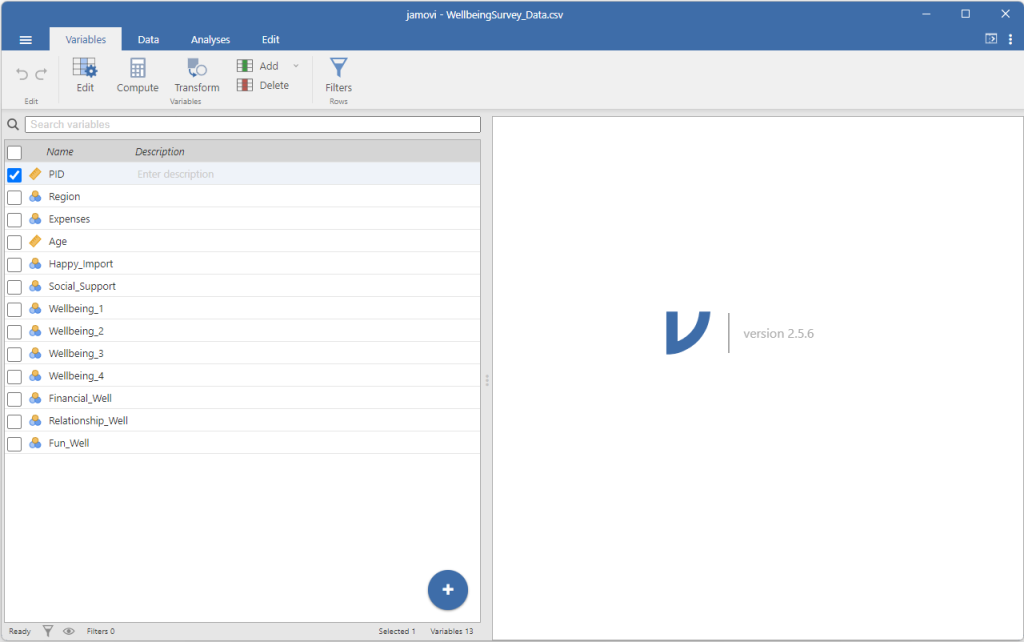
In Variables view, you will see a list of the variables in your data set, including the Name, Description, and a symbol that indicates the variable measure type (nominal, ordinal, continuous, or ID). This view is useful for reviewing all the variables in your dataset and locating a specific variable when you have many of them.
The top ribbon provides options for editing variable information, computing new variables, and transforming existing variables.
2.6.2 Data
In Data view, you will see a spreadsheet view of your data. In Data view:
- Each line represents a participant’s responses (the Well-being dataset had 400 participants, therefore there are 400 lines in the data view spreadsheet)
- Each column represents a variable (i.e., the participant’s response to each question in the Well-Being survey)
The top ribbon provides similar options to Variables view: setup variable information, computing new variables, and transforming existing variables.
2.6.3 Analyses
In Analyses view you will also see the spreadsheet view of your data. However, now the top ribbon options include menus of different groups of statistical analyses.
