3 Data Management and Manipulation
3.1 Setup/Edit Variables
In Variables view, select the row of the variable you would like to setup/edit and select Edit from the top ribbon or double-click on the row of the variable you would like to edit.
In Data view, select the column of the variable you would like to setup/edit and select Setup from the top ribbon or double-click the column/name of the variable you would like to edit.
3.1.1 Name
On the first line, enter the name of the variable. Do not use any spaces in your variable name. When you have a scale with multiple items, it is convenient to name them scale1, scale2, etc. For example, if your scale measures extraversion, you can name your items extravert1, extravert2, extravert3, extravert4.
Note. In jamovi you can technically use a variable name with a space. However, I strongly recommend using variable names without spaces to simplify other functions within jamovi. If you do have a variable name with a space, you will need to add single quotations to each variable when transforming or computing new variables, e.g., ‘Life Satisfaction’. For similar reasons, you should also avoid using single or double quotations in variable names.
3.1.2 Description
Include a variable description here. If the variable corresponds with an individual item/question, it is a good idea for the description to be the actual question you asked participants.
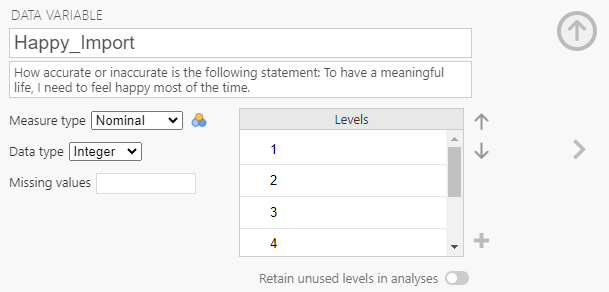
3.1.3 Measure Type
Indicate via the dropdown box what measurement type the variable is.
 Nominal – a variable with groups that have no order (also called categorical).
 Ordinal – a variable with groups that do have an order, but the distance between ranks is not equal
 Continuous – a variable is continuous (interval or ratio), there is an order to the response options and the distance between each one is equal.
 ID – variable is a participant ID number. The number itself is not meaningful other than as a way to identify the participants.
It is important that your variables have the correct measure type selected because jamovi will often limit how you can use a variable based on its measure type. Measure type can also change how an analysis is run (e.g., nominal versus continuous predictors in multiple regression).
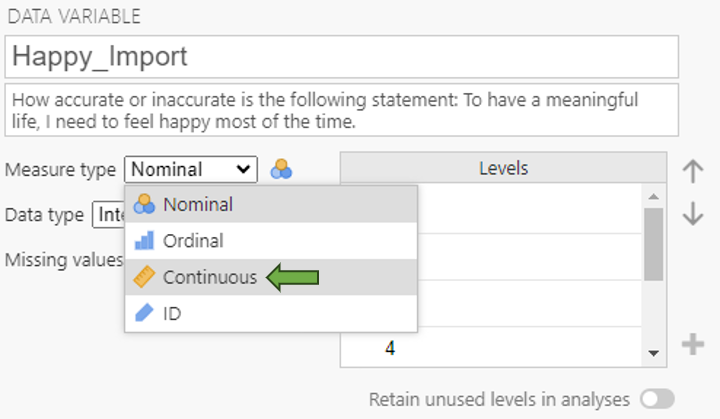
Note. In psychology, we often use Likert-type scales as response options (e.g., a very much agree to very much disagree scale). Psychologists usually treat these variables as continuous. However, when you open data in jamovi, Likert scales are often identified as nominal. Therefore, it is important to check each variable has the correct measure type after opening a new dataset.
3.1.4 Data Type
Indicates whether the data are integers (whole numbers), decimals, or text. This option will auto update based on the type of data you input.
3.1.5 Missing Values
If you are using a specific value to indicate missing values (example: -99) you can specify that value here
3.1.6 Levels
In this box you can specify the different levels of the variable.
- Nominal Variables: for nominal variables we often use values like 1 and 2 to indicate different groups, such as people living in the northeast vs. southwest. However, these numbers are arbitrary (i.e., 1 could be used to indicate people in the northeast or 1 could be used to indicate people in the southwest, it’s up to the researcher to decide how they want to code the variable). Therefore, it is important to add labels to the levels of your variable so that it is clear how you coded the variable.
- Continuous Variables: Jamovi does not allow you to add labels to the levels for continuous variables
To add a label to a level, click on the number and type in a descriptive label.
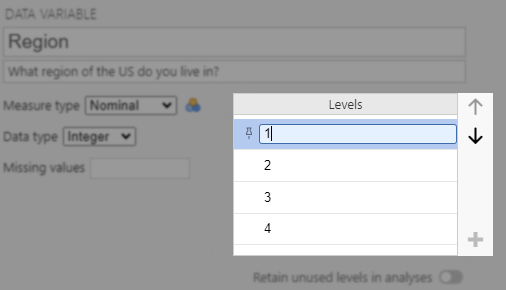
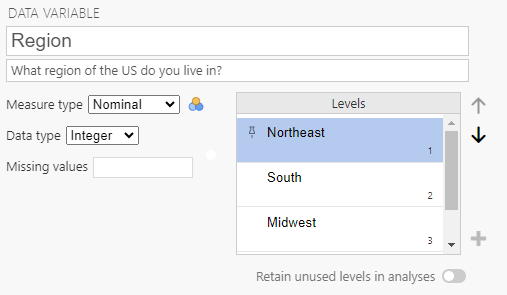
Note. Although it is a best practice to avoid spaces in variable names, you can use spaces in level names without the same negative effects as variable names with spaces. For example, the fourth level of the Region variable is labeled West Coast.
3.2 Transforming Variables
Why? Sometimes we “reverse code” an item. That is, we ask a question where the answer indicates the opposite of the construct we are trying to measure. For example, the four items we used to measure subjective well-being are:
To what extent do you agree or disagree with the following statements?
- I like how my life is going.
- I am content with my life.
- If I could live my life over, I would change many things.
- I am satisfied with where I am in life right now.
If a participant selects strongly agree for the first item, this response would indicate that the participant has a high level of well-being (the construct we are interested in). The same is true for the second and fourth items. However, for the third item, “If I could live my life over, I would change many things”, if a participant selects strongly agree, that response would indicate a low level of well-being. When using multi-item scales such as the one above, psychologists usually average together the participants’ responses to have one number indicating the participants’ level of the construct (in this case, well-being). However, we cannot average together the responses to these items as is because higher numbers mean more well-being for three of the items but the opposite is true for one of the items. Therefore, before we can average the items together, we need to switch the direction of participants’ answers for the third item so the direction matches the rest of the items in the scale.
Other times, we want to recode responses into another meaningful variable. For example, suppose the item is a factual multiple-choice question where the second answer is the correct answer. In that case, we might want to recode that variable into a new variable, indicating the participant answered the question correctly (coded 1) or incorrectly (coded 0). We could then sum a set of variables to indicate how many questions the participant got correct (see section 3.4 Computing Variables).
There are a few ways you can create a transformed variable
- In either Data or Analyses view, double-click on an empty column. Then select New Transformed Variable. You can then select the variable you want to transform in the dropdown menu next to Source variable.
- Select an existing variable that you want to transform in either the variable view or data view. On the top ribbon, select Transform.
For this example, we will reverse-transform the third well-being item [Wellbeing_3].
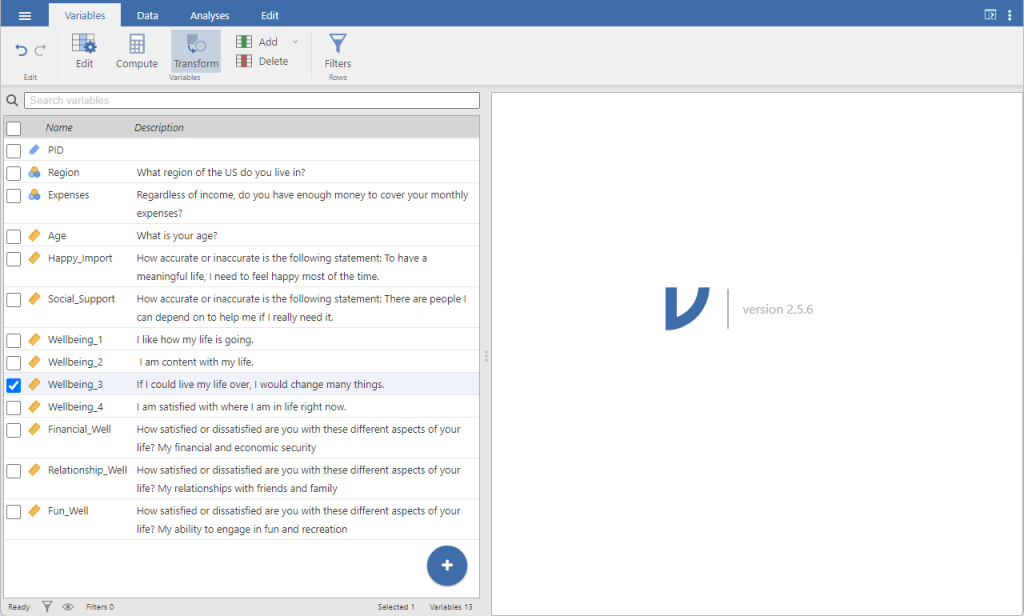
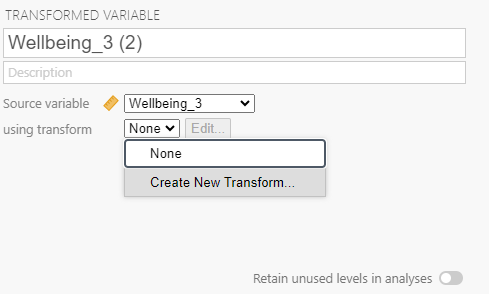
Jamovi will automatically change the name to Wellbeing_3 (2). However, it’s good practice to give the variable a more meaningful name and a description. You can rename your variable first, or you can add a renaming convention to your transformation rule (which is what we will do here).
Next, you will need to tell jamovi how you want to transform the variable. From the using transform menu, select Create new transform.
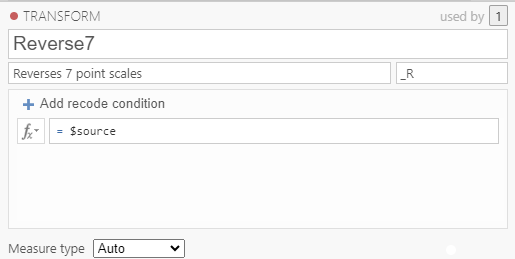
A new transform menu will appear. You can name and provide a description of the transformation. This is helpful if you have multiple items that need to be transformed in the same way. For example, if there are multiple items that need to be reverse transformed and they use the same scale (e.g., a 7-point scale). Once you create a transform rule, you can reuse it on other variables.
You can also add a suffix to the rule. If you add a suffix, the current variable and any future transformed variable that you apply this rule to will automatically add the suffix to the original variable’s name to create the name for the transformed variable. Here we are using “_R”. I recommend using the “_” because it will keep the formatting neater.
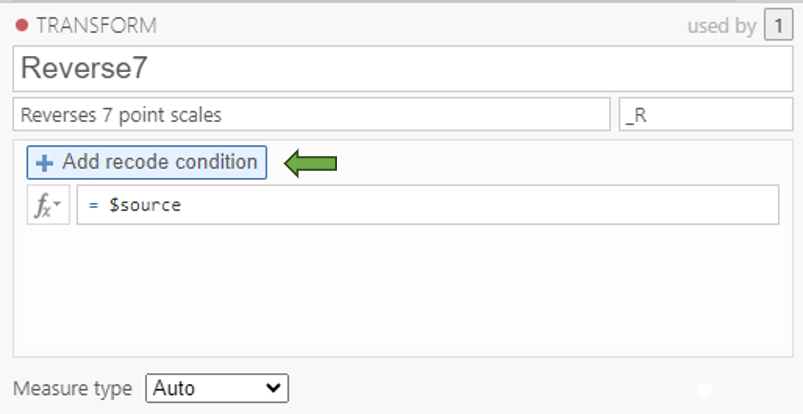
Next, you will need to click + Add recoded condition.
Two windows will appear: if $source and else use. These use “if/then else” logic.

You will need one if $source window for each level in your response scale. For the Wellbeing_3 item, participants responded on a 7-point scale, so we will need to add 7 recode conditions and therefore need 7 if $source windows.
In each recode condition, you will tell jamovi how to recode each point the 7-point scale. See example below
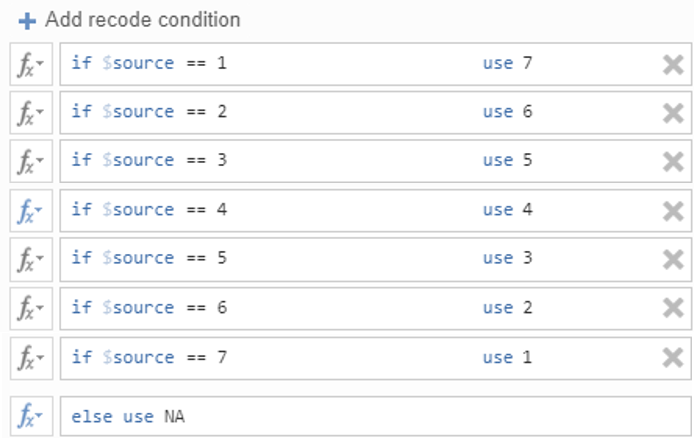
Once you have set up your transformation, click the ↓ button to return to the transformed variable menu and then the ↑ to close the transformed variable menu. You will see that your new variable’s values automatically update.
Important notes
- In jamovi, you need to use two = signs (i.e., ==) to specify that if the source variable equals [X], then recode it to [Y]. You can also use other logical operators like > (greater than), < (less than), >= (greater than or equal to), <= (less than or equal to), or != (not equal to), depending on the type of transformation you would like to use.
- Technically, the last recode condition (if $source == 7 use 1) is not necessary, we could have used “else use 1”. However, there are two good reasons to add “if $source == 7 use 1” and then add “NA” (i.e., mark it as missing data) to the else use window: 1) If you have any missing data (which we often do) this coding technique will make sure they remain missing and are not coded 1, 2) If there are any unexpected values in the data set due to error, using this technique means those error values will also be coded as NA.
3.3 Reliability Analysis
Before calculating a new variable that represents a set of questions, you must make sure the individual items are measuring the same construct. One way of doing this is to test whether the items are all inter-correlated with each other. The statistic Cronbach’s Alpha tells us how inter-correlated a set of items are.
Analyses tab → Factor → Reliability Analysis
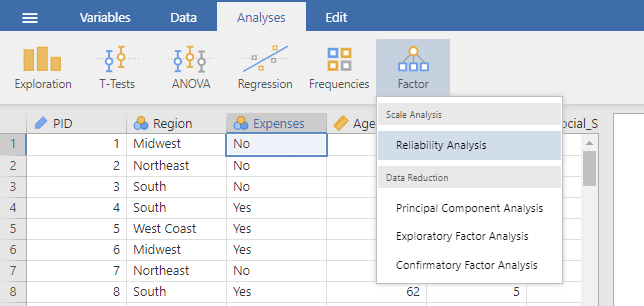
- Select the continuously measured items from your scale and move them to the Items window. If any items are reverse-coded, make sure to use the transformed version of the variable.
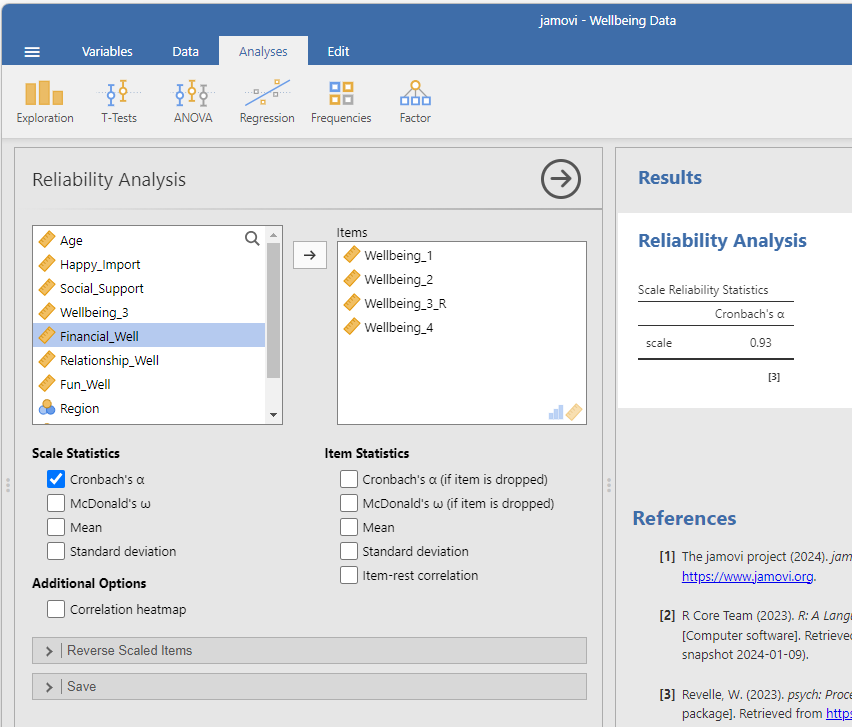
- Report Cronbach’s Alpha as α = .93
- Cronbach’s Alpha above .70 is considered acceptable. Ideally, you want the alpha to be above .80.
- If your alpha is lower, select Cronbach’s α (if item is dropped) to determine if excluding any of the items improves the alpha.
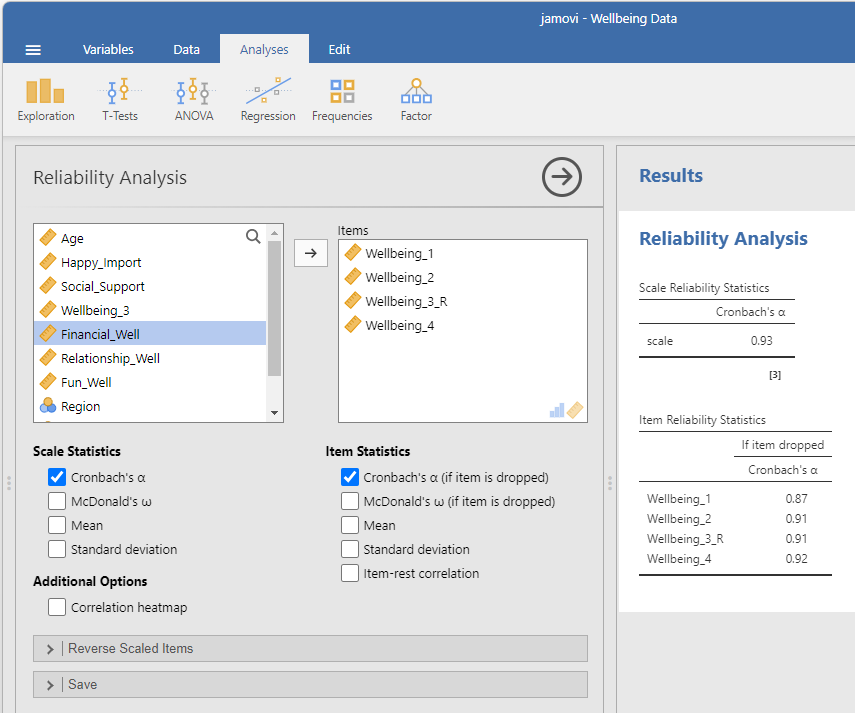
- Our alpha was acceptable, so we want to use all four items when calculating participants’ well-being scores. Looking at the item reliability statistics, we can also see that dropping any of the items will not improve the reliability of the scale (the alpha will not increase).
3.4 Computing Variables
- Common example: Multi-item scale meant to assess participants’ level on a single construct
- Scale items can be summed or averaged to create a single index representing each participant’s score on the construct.
- Less common examples:
- Transforming an existing variable to make its distribution more normal
- “Centering” predictor variables in multiple regression
In the Well-being Dataset, we used four items to measure subjective well-being. Participants responded to four individual items, but they all tried to measure the same psychological construct: participants’ level of well-being. Therefore, we need to combine participants’ scores on the four items so that we have one variable that quantifies each participant’s level of well-being. In psychology, it is common to average the individual items that are meant to measure one variable (as opposed to summing them, for example). Averaging the items is generally preferred because the resulting score is on the same scale as the original items and therefore more interpretable. For example, let’s say that Participant A responded:
- slightly agree to the first item (coded 5)
- moderately agree to the second item (coded 6)
- moderately disagree to the third item (recall this was the reverse coded item, so originally it would be coded 2, but the reverse transformation variable that we will use in the computation would have a score of 6)
- strongly agree to the fourth item (coded 7)
If we average the scores together, we get a mean score of 6. Interpreting this on the original response option scale used, we would say that the participant “moderately agreed” with the well-being statements, on average.
Before computing a new variable, you should first check the reliability of the scale, see above.
There are a few ways you can create a computed variable
- In either Data or Analyses view, double-click on an empty column. Then select New Computed Variable
- In Variable or Data view, click Compute on the top menu ribbon
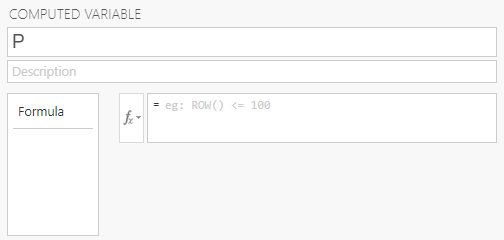
Once you select one of the options to compute a variable, you will see the above menu with a letter as the variable name. Just like earlier, you will want to give your new variable a meaningful name and description. In the description, it’s a good idea to say how your new variable is calculated.
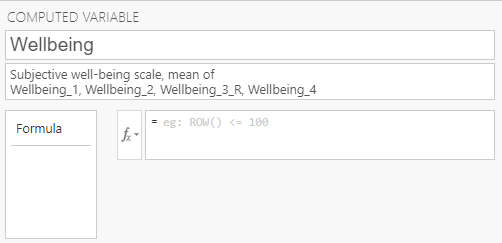
Here, I have named the variable “Wellbeing” and gave it a description that includes how the variable will be calculated. Note, I’m using our transformed Wellbeing_3_R variable instead of the original Wellbeing_3 variable. Recall that for the Wellbeing_3 item, “If I could live my life over, I would change many things”, higher numbers indicate less well-being, whereas for the other items, higher numbers indicate greater well-being. Therefore, we want to use the reverse coded item Wellbeing_3_R so that for all items we average, higher numbers indicate greater well-being.
Next, we will specify how we want the variable computed. Clicking on ![]() will display a menu with all of the available mathematical functions you can use. In this example, we want to take the average of the four items (i.e., the mean) for each participant, so we will double-click on MEAN.
will display a menu with all of the available mathematical functions you can use. In this example, we want to take the average of the four items (i.e., the mean) for each participant, so we will double-click on MEAN.
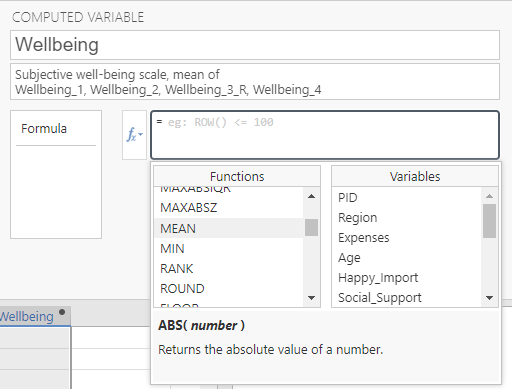
Note. Single-clicking on any function will give you a short description of the function.
Next, we will click ![]() again and double-click on the variables we would like to use: Wellbeing_1, Wellbeing_2, Wellbeing_3_R, Wellbeing_4.
again and double-click on the variables we would like to use: Wellbeing_1, Wellbeing_2, Wellbeing_3_R, Wellbeing_4.
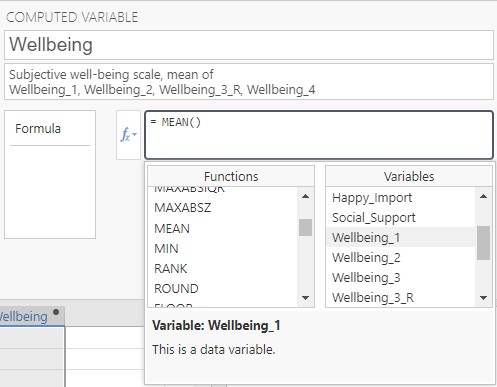
We will need to add a comma between each variable.
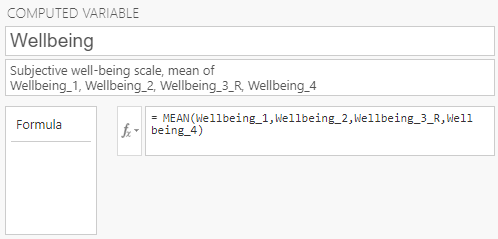
Jamovi will then automatically calculate the mean well-being score for each participant. Click ↑ and you’ll be able to see the calculated scores in Data or Analysis view.
