5 Correlation and Simple Regression
Both correlation and simple regression can be used when you want to determine the relationship between a continuous predictor variable and a continuous outcome variable. In psychology, we usually report the correlation coefficient and its statistical significance as the test of the relationship between two continuous variables. Simple regression is used when you want to determine the relationship between two continuous variables and you want to predict a person’s score on the outcome variable if you have their score on the predictor variable. However, the two tests are actually the exact same, just presented differently — correlation is a standardized measure, and regression coefficients can be calculated as unstandardized (in the units of the predictor and outcome variables) or standardized (in standard deviation units). In psychology, we usually report correlations rather than simple regression because we are more interested in the relationship between variables than in predicting specific scores.
In this section, we will test the relationship between age, how important happiness is to the participant, social support, and well-being (using our computed variable, the average of the four well-being items).
5.1 Visualizing Correlations
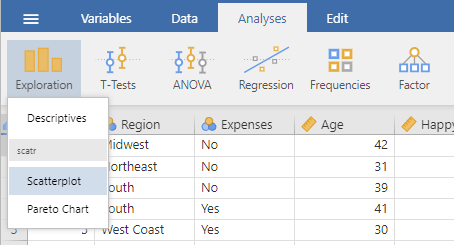
To visualize a correlation, use a scatter plot: Analysis tab → Exploration → Scatterplot
To visualize the relationship between age and well-being, add the variable Age to the X-Axis window and the variable Wellbeing to the Y-Axis window.
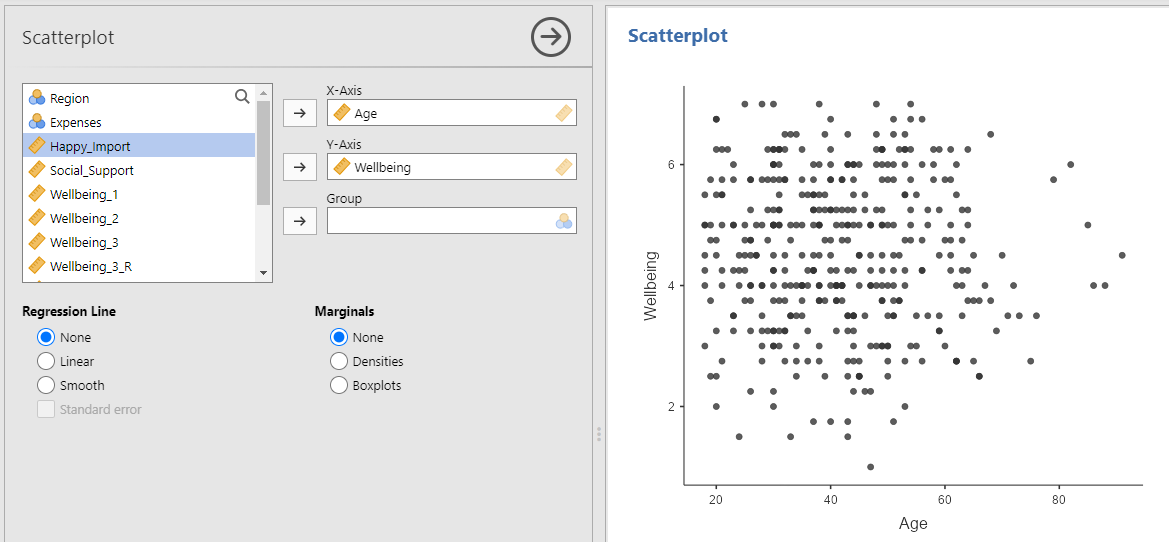
Here we can see there does not appear to be a relationship between age and well-being, something we test statistically next.
Note. Jamovi’s plots do not adhere to APA style and should not be used in APA-style student lab reports.
5.2 Computing Correlations and Significance Tests
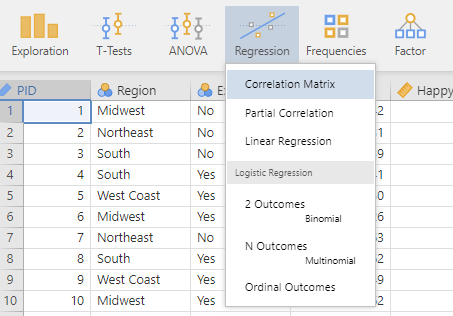
To compute a correlation, use the correlation matrix menu: Analysis tab → Regression → Correlation Matrix
You can test the correlations between a group of variables by adding each variable of interest to the right window. Here we are testing the correlation between age, happiness importance, social support, and well-being.
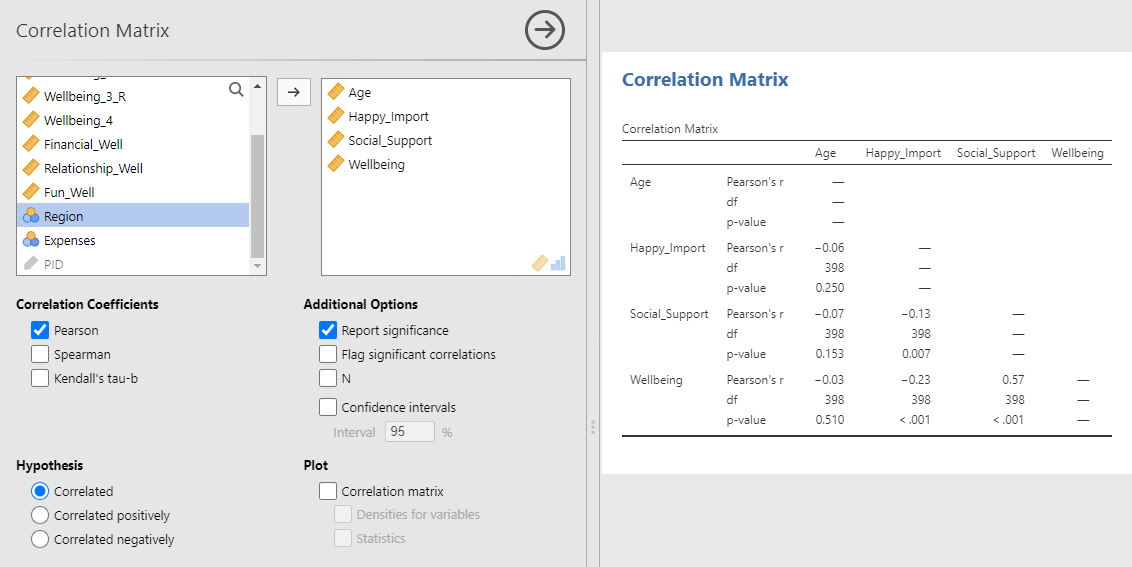
The options selected above, Pearson and Report significance, are the default options for correlations. If you want to test the correlation between two ordinal variables, you can select Correlations Coefficients, Spearman instead of Pearson.
5.3 Reporting Correlations in APA Style
Example 1: A non-significant correlation
There was no correlation between participants’ age and their well-being r(398) = −.03, p = .51.
Example 2: A significant negative correlation
There was a negative correlation between happiness importance and well-being, r(398) = −.23, p < .001. In other words, the more participants thought happiness was important for a meaningful life, the lower well-being they reported.
Example 3: A significant positive correlation
Greater perceived social support was associated with higher levels of well-being, r(398) = .57, p < .001.
Important Notes for Reporting Results
- Use descriptions of the variables rather than the variable names from jamovi. E.g., “perceived social support” rather than “Social_Support” and “happiness importance” or “participants thought happiness was important for a meaningful life” rather than “Happy_Import”.
- When a correlation is significant, always interpret what that correlation means for the relationship between the two variables. The interpretation should include the directional relationship between the variables. For example, as X variable increased, Y variable decreased (a negative correlation), or higher levels of X variable were associated with greater levels of Y variable (a positive correlation). You can do this by either first stating the correlation is negative or positive, then interpreting the relationship, like in example 2, or simply interpreting the correlational relationship, such as in example 3.
- For notes on formatting statistical statements, see Appendix Reporting Statistics in APA style.
5.4 Computing Simple Regression
To compute a simple regression, use the linear regression menu: Analysis tab → Regression → Linear Regression
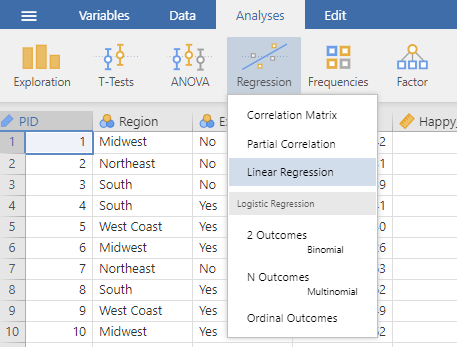
Add the continuous outcome variable you are interested in to the Dependent Variable window and the continuous predictor variable to the Covariates window.
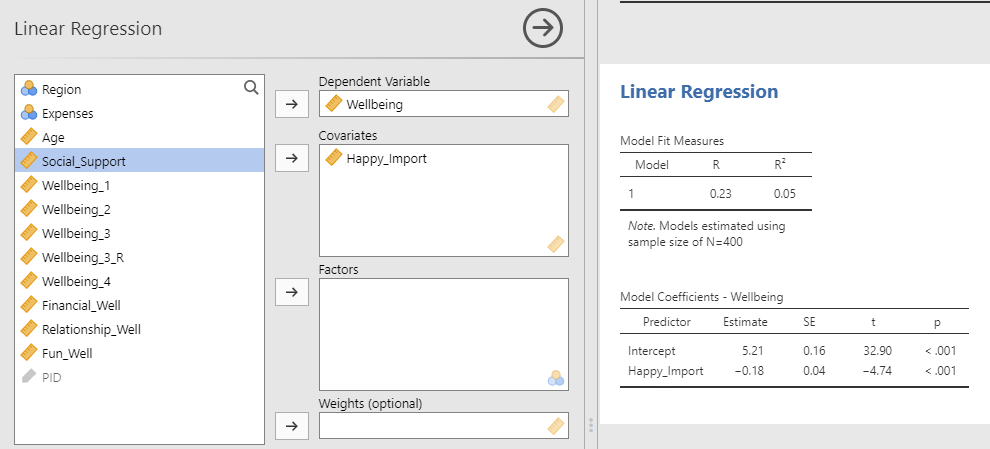
Notice that the R for the simple regression is the same as the r for the correlation coefficient above in the correlation section (they are the same test).
The R2 is an effect size measure. This tells us how much variance in the DV is explained by the IV. In this case, 5% of the variance in well-being is explained by how important happiness is to the participant.
The significance test reported here for the “Happy_Import” variable is the same as the significance test of the correlation in the above section.
By default, jamovi gives you the unstandardized regression coefficient (B) in the Estimate column. If you prefer standardized coefficients (β), you can request them in the Model Coefficients sub-menu under Standardized Estimate.
5.5 Reporting Simple Regression in APA Style
Example: A significant simple regression with a negative predictor
A simple regression indicated that the more participants thought happiness was important for a meaningful life, the lower well-being they reported, B = −0.18, SE = 0.04, p < .001, R2 = .05.
Important Notes for Reporting Results.
- Use descriptions of the variables rather than the variable names from jamovi. E.g., “participants thought happiness was important for a meaningful life” rather than “Happy_Import”.
- When a simple regression is significant, always interpret the direction of the relationship rather than just saying it is significant. As one variable goes up, what happens to the second variable? For example, as X variable increased, Y variable decreased (a negative relationship), or higher levels of X variable were associated with greater levels of Y variable (a positive relationship).
- B denotes an unstandardized regression coefficient and is found in the Estimate column.
- If you report B and SE, you do not need to report the t-statistic (because t = B ÷ SE and, therefore, is redundant information).
- If you choose to report the standardized regression coefficient, only report β, the p-value, and R2.
- For notes on formatting statistical statements, see Appendix Reporting Statistics in APA style.
