7 T-tests
T-tests are broadly used when we want to compare two means. We can compare the mean of a sample to the mean of a population (or a known value) by using a one sample t-test. Perhaps the most common t-test is the independent sample t-test, where we compare the means of the dependent variable for two independent groups (two levels of a between-subjects independent variable). We can also use a paired t-test when we want to compare the means of the dependent variable for the two levels of a within-subjects independent variable—for example, comparing the mean of the dependent variable before an intervention to the mean after an intervention.
7.1 Computing One Sample T-tests
One sample t-tests are used when you have a continuous variable and want to compare the mean of a sample to the mean of a population or to some specific/known number.
In this section, we will be looking at the mean level of well-being in our sample. When we conducted our survey, we advertised it as a survey about happiness. In retrospect, you are worried that people who are particularly low in well-being may have avoided the survey. We know from nationally representative surveys that people in the US score 4.35 on average using the same well-being scale we used in our survey. So, our research question is: Did people in our survey have a significantly different level of well-being compared to 4.35, the national average?
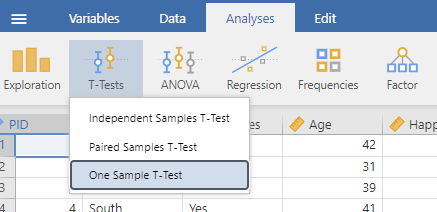
To compute a one sample t-test, use the t-test menu: Analysis tab → T-Tests → One Sample T-Test.
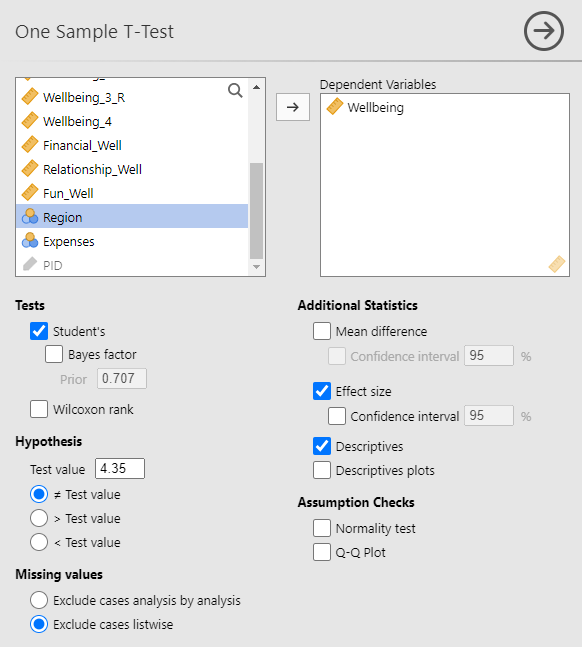
Add the outcome variable you are interested in to the Dependent Variable window (note this variable must be a continuous variable). Under Hypothesis, add our comparison value to the Test value box (in this example, 4.35). Other options you should request: under Additional Statistics, click Effect Size and Descriptives.
These options produce the results tables below:
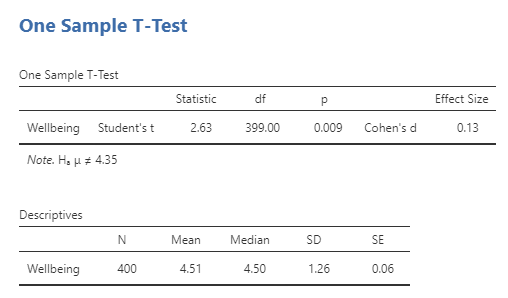
The first table tells us the results of our one sample t-test. The second table gives us the descriptive statistics for well-being in our sample. We will need both when reporting out results in APA style.
7.2 Reporting One Sample T-tests in APA Style
A one sample t-test indicated that our sample had higher well-being on average (M = 4.51, SD = 1.26) compared to the national average (M = 4.35), t(399) = 2.63, p = .009, Cohen’s d = 0.13.
Important Notes for Reporting Results
- Report the mean and standard deviation of your sample in parentheses after you mention your sample’s score on the dependent variable. These numbers can be found in the Descriptives table. Report the comparison mean in parentheses after you mention the comparison group.
- If there the test is significant, indicate that your sample was higher/lower than the comparison number.
- Don’t forget the dv and your comparison number! Our sample had higher well-being compared to the national average.
- Make sure to include the effect size. For a one sample t-test, report Cohen’s d. Cohen’s d describes the difference in means as the number of standard deviations that separate those means.
- For notes on formatting statistical statements, see Appendix Reporting Statistics in APA Style.
7.3 Computing Independent Samples T-test
Independent samples t-tests are used when you have
- One nominal independent/predictor variable
- The independent/predictor variable has 2 levels (aka, conditions or groups)
- A between-subjects design (participants complete only one level of the independent variable or are represented by only one level of the predictor variable)
- A continuous dependent/outcome variable
In this section, we will answer the research question, “Does having enough money to cover one’s monthly expenses (compared to not having enough money) impact well-being?”.
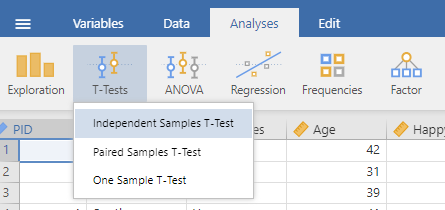
To compute an independent samples t-test, use the t-test menu: Analysis tab → T-Tests → Independent Samples T-Test.
Add the continuous dependent variable you are interested in to the Dependent Variable window. Add the nominal independent variable to the Grouping Variable window. Other options you should request: under Additional Statistics, click Effect Size and Descriptives.
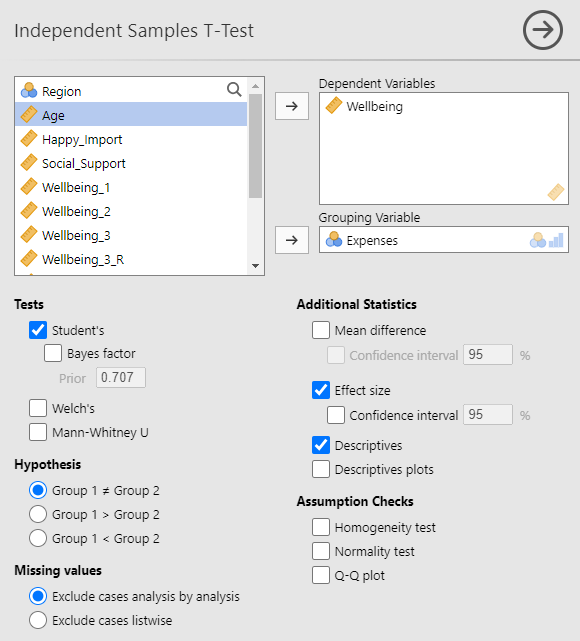
These options produce the results tables below:
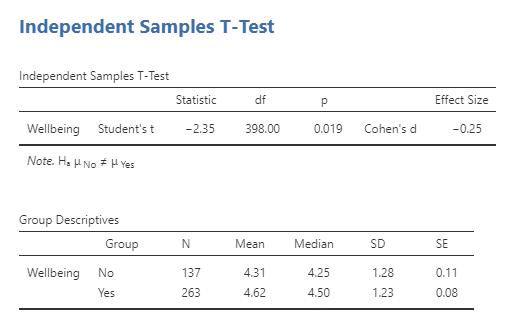
The first table tells us the results of our independent sample t-test. The second table gives us the descriptive statistics for well-being (the DV) for people who responded “No” they do not have enough money to cover their monthly expenses, and for people who responded “Yes” they do have money to cover their monthly expenses (levels of the IV) . We will need both when reporting the results in APA style.
7.4 Reporting Independent Samples T-tests in APA style
The results of an independent samples t-test indicated that people who do not have enough money to cover their monthly expenses report lower well-being (M = 4.31, SD = 1.28) compared to people who do have enough money to cover their monthly expenses (M = 4.62, SD = 1.23), t(398) = −2.35, p = .02, Cohen’s d = −0.25.
Important Notes for Reporting Results
- Report the dependent variable mean and standard deviation for each group (level of the independent variable) in parentheses after you mention the group. These numbers can be found in the Group Descriptives table.
- If the t-test was significant, indicate which group was higher/lower on the dependent variable.
- Don’t forget the dependent variable and the comparison group! People who cannot afford their monthly expenses have lower well-being compared to people who can afford their monthly expenses. Make sure to describe the dependent variable and levels of the independent variable rather than using the variable name and level labels from jamovi.
- Make sure to include the effect size. For an independent samples t-test, report Cohen’s d. Cohen’s d describes the difference in means as the number of standard deviations that separate those means.
- For notes on formatting statistical statements, see Appendix Reporting Statistics in APA Style.
7.5 Computing Paired Sample T-tests
Paired samples t-tests (also called dependent samples t-tests) are used when you have
- 1 nominal independent/predictor variable
- The independent/predictor variable has 2 levels (conditions)
- Within-subjects design (participants complete both levels of the independent/predictor variable)
- A continuous dependent/outcome variable.
A note on within-subjects designs and data organization.
Recall that data is usually organized in jamovi so that every row represents a participant. Participants’ responses to each question in the well-being survey are then represented in each column. In between-subjects experimental research designs, it is common to have one column indicate what experimental condition the participant was in (this column is the independent variable) and additional columns for the participant’s responses to the dependent variable(s). So far, in all of our examples, each column represented just one variable (e.g., age, whether the participants can afford their monthly expenses, well-being, etc.). However, for within-subjects research questions, data is organized slightly differently. Because the research subject participates in all levels of the independent/predictor variable, there are multiple measures of the dependent/outcome variable, one for each independent/predictor variable level. For example, in addition to asking about generalized well-being, we also asked participants about their well-being in specific domains of their life: financial well-being, relationship well-being, and fun and recreation well-being. In our data, there is one column for each of these questions, but these three columns can represent multiple variables. If we are interested in the within-subject question “Does well-being differ across the three life domains?”, then the three columns represent both the predictor variable “life domain” and the outcome variable “well-being”.
In this section, we will answer the research question, “Do participants have higher relationship well-being compared to their financial well-being?”.
To compute a paired samples t-test, use the t-test menu: Analysis tab → T-Tests → Paired Samples T-Test.
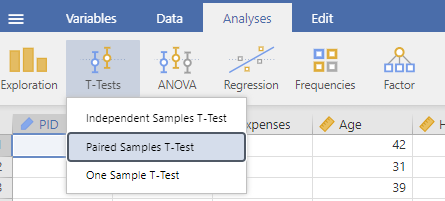
In the Paired Variables window, add the two columns that represent participants’ responses to the dependent variable for the two levels of the independent variable. Other options you should request: under Additional Statistics, click Effect Size and Descriptives.
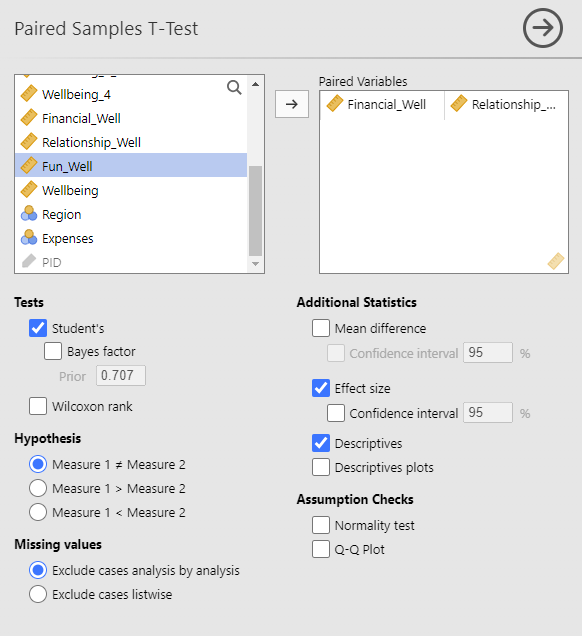
These options produce the results tables below:
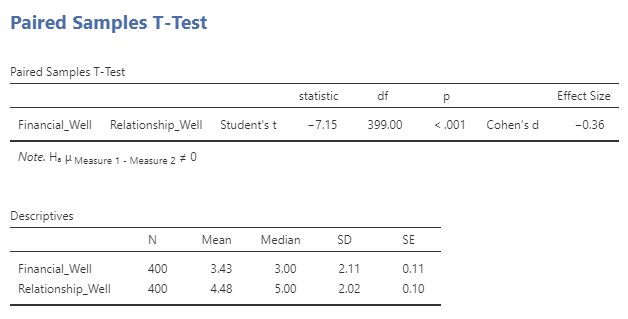
The first table tells us the results of our paired samples t-test. The second table gives us the descriptive statistics for well-being (the DV) for both the financial domain and the relationship domain (the two levels of the within-subject IV, life domain).
7.6 Reporting Paired Samples T-test in APA Style
The results of a paired samples t-test indicated that participants had higher relationship well-being (M = 4.48, SD = 2.02) compared to their financial well-being (M = 3.43, SD = 2.11), t(399) = −7.15, p < .001, Cohen’s d = −0.36.
Important Notes for Reporting Results
- Report the mean and standard deviation of the dependent variable for each level of the independent variable in parentheses after you mention it. These numbers can be found in the Descriptives table.
- If the t-test was significant, indicate which group was higher/lower on the dependent variable.
- Make sure to describe the variables rather than just using the variables’ names from Jamovi. For example, relationship well-being rather than Relationship_Well and financial well-being rather than Financial_Well.
- Make sure to include the effect size. For a paired samples t-test, report Cohen’s d. Cohen’s d describes the difference in means as the number of standard deviations that separate those means
- For notes on formatting statistical statements, see Appendix Reporting Statistics in APA Style.
