2 Data Visualization in Python
Libraries:
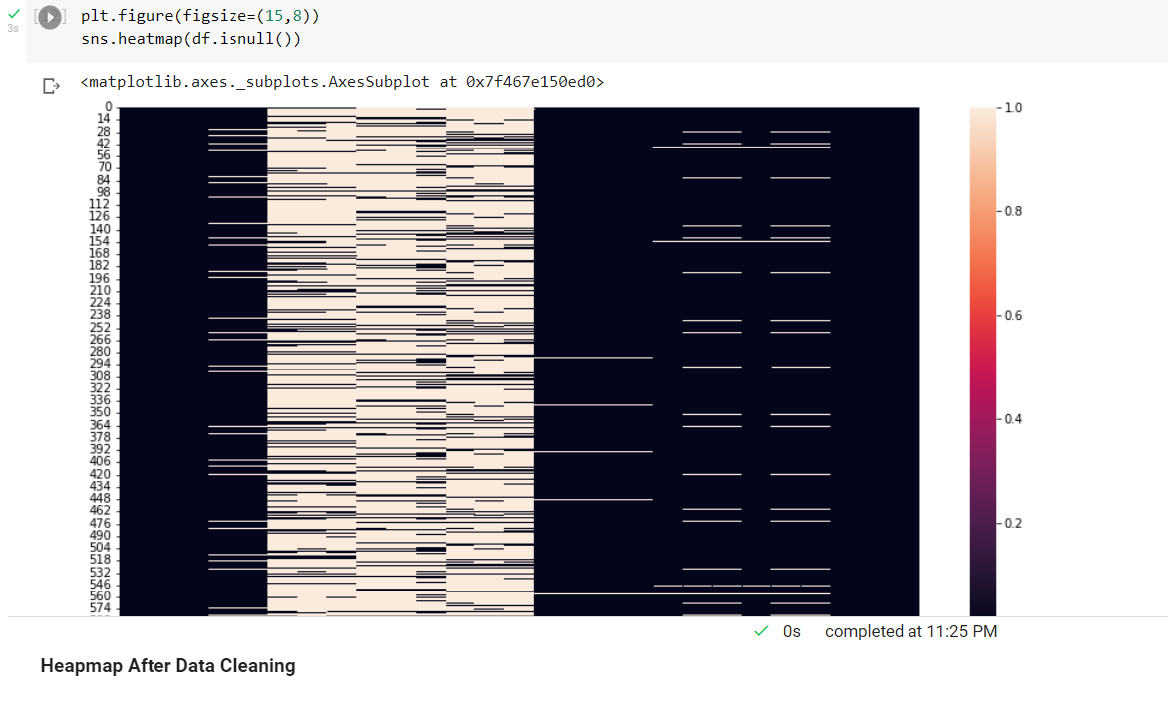
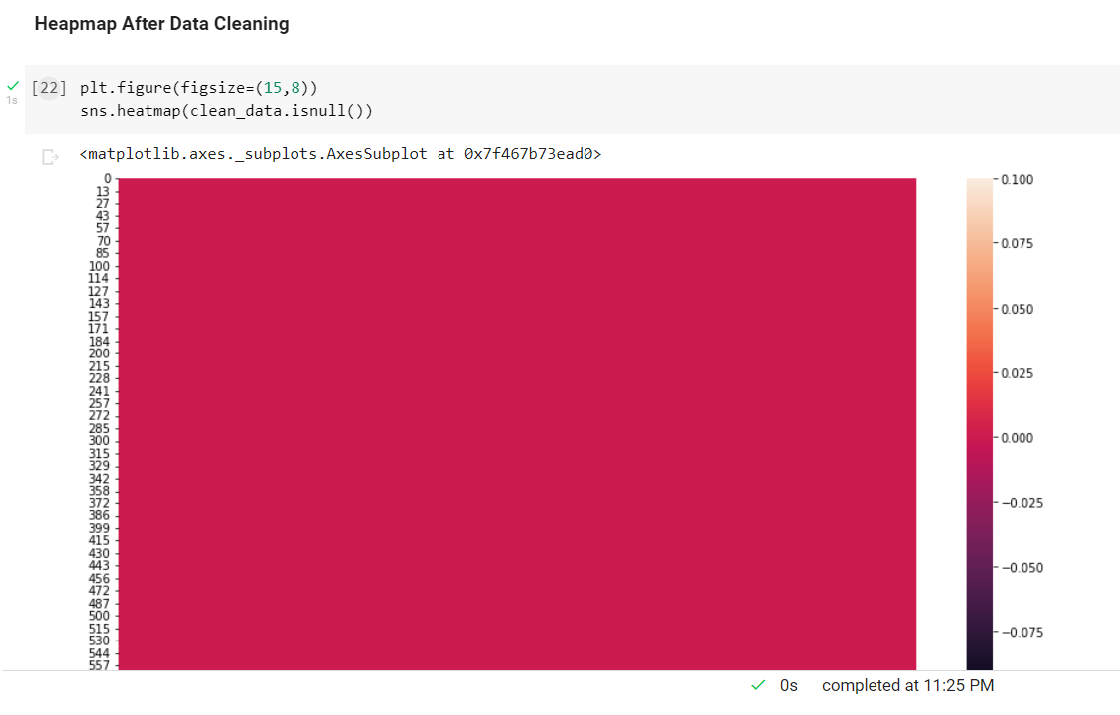
Python provides a number of plotting libraries, including Matplotlib, Seaborn, and numerous other data visualisation utilities with various features for creating informative, customized, and visually appealing plots to present data in the simplest and most effective manner.
Exercise using Python:
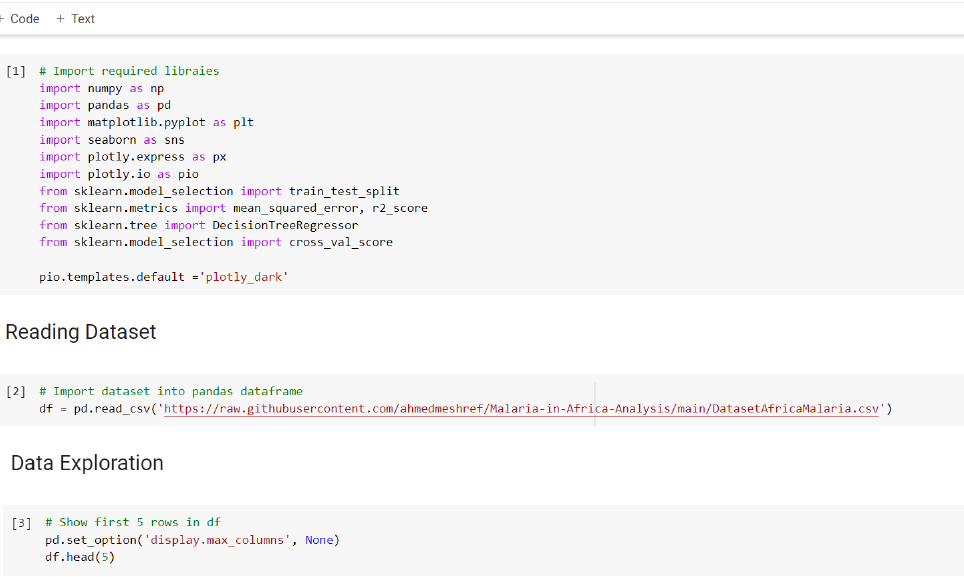
Visualizing the malaria in Africa dataset and modelling the expected number of malaria cases using Decision Tree Regression.
Introduction:
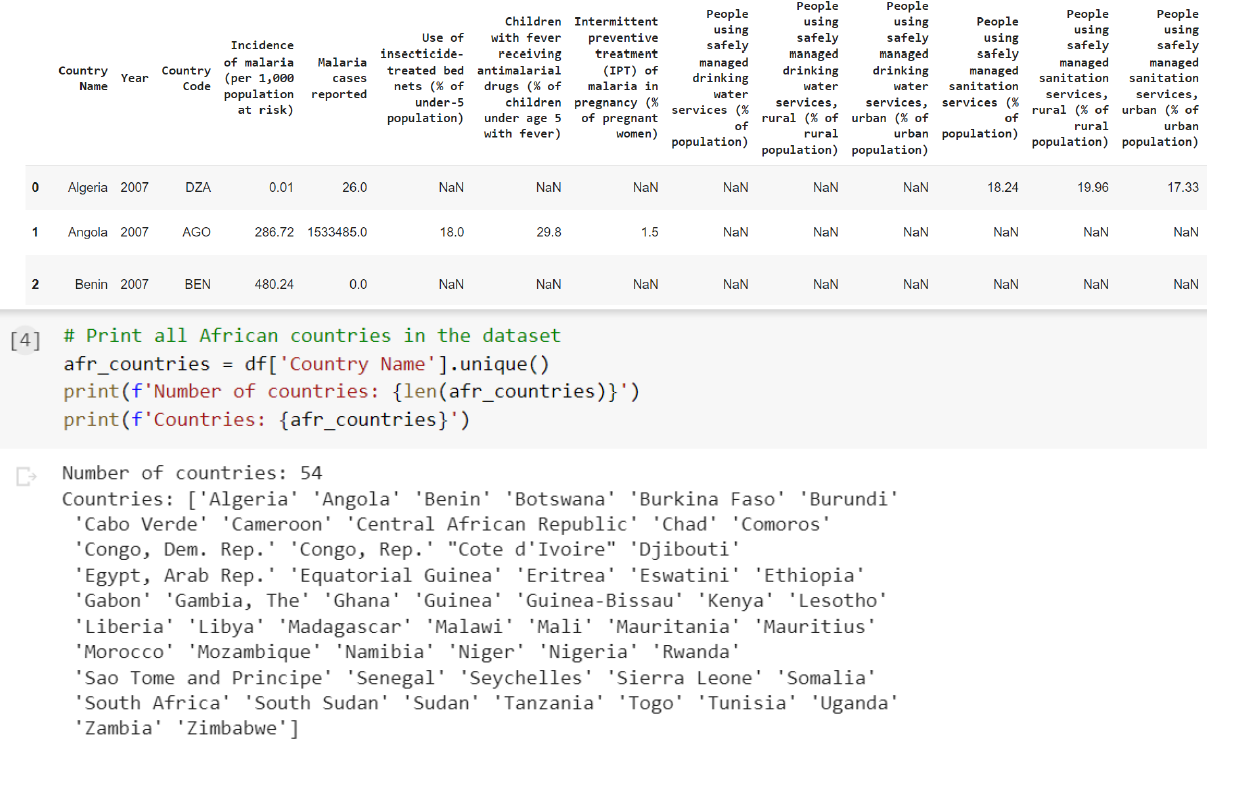
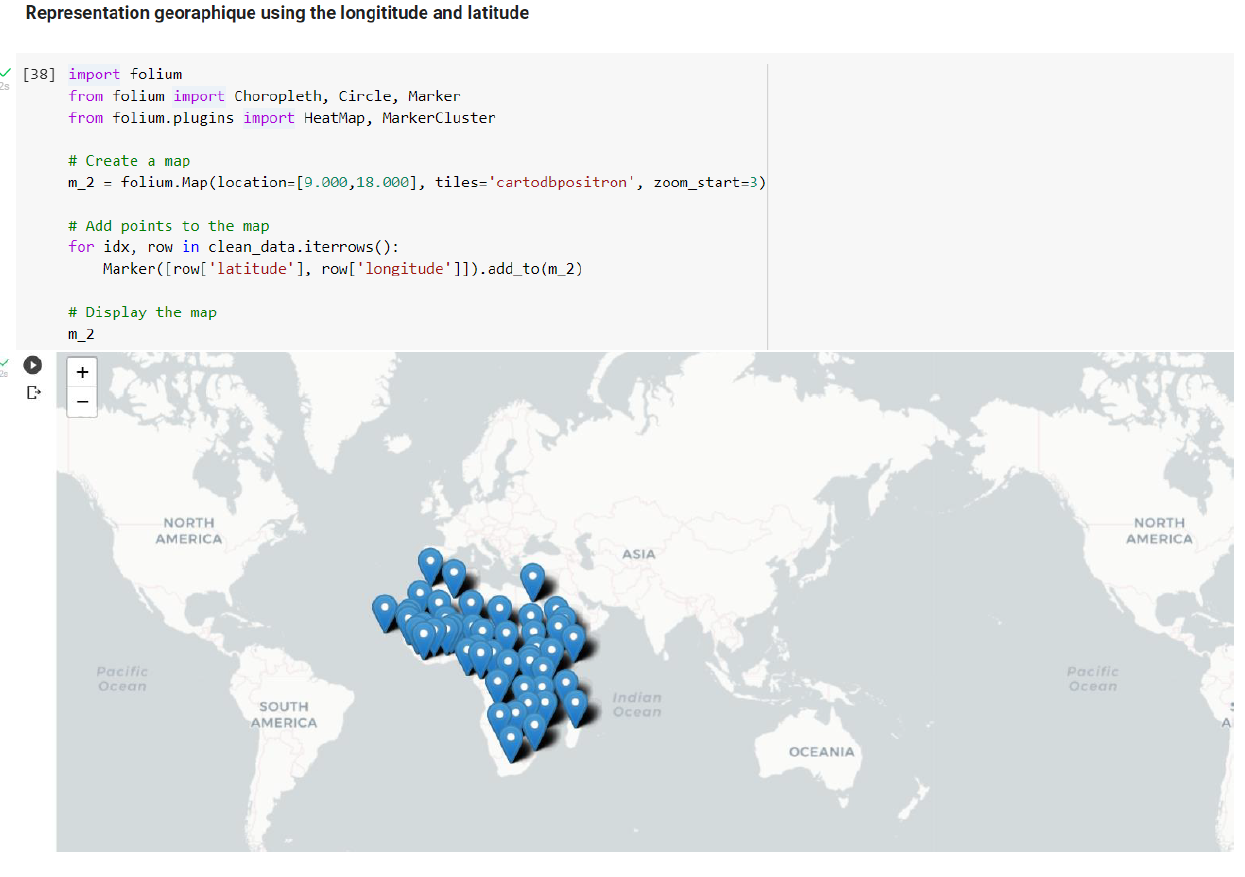
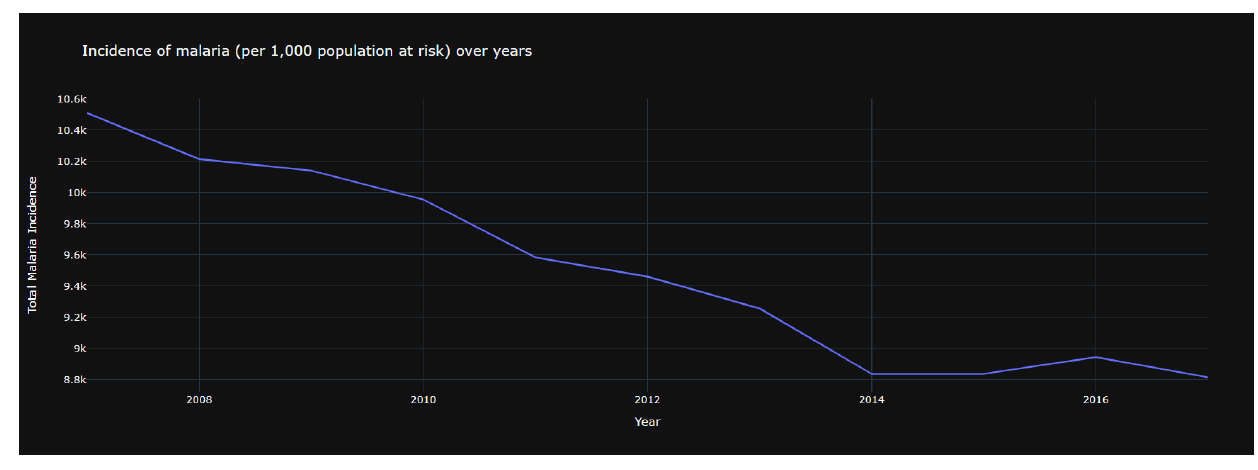
Africa, the world’s second-largest continent, a continent with a wide array of vibrant cultures each with its own deep history, continent number 2 of largest population, and the continent is home to wonderful wildlife you can spot when you go on safari. Malaria is a common disease in Africa. The disease is transmitted to humans through infected mosquito bites. Although you can take preventive measures against malaria, it can be life-threatening. This dataset includes the malaria cases in African countries, the incidence at risk, and data on preventive treatments against malaria.
DATASET:
Link: https://www.kaggle.com/lydia70/malaria-in-africa
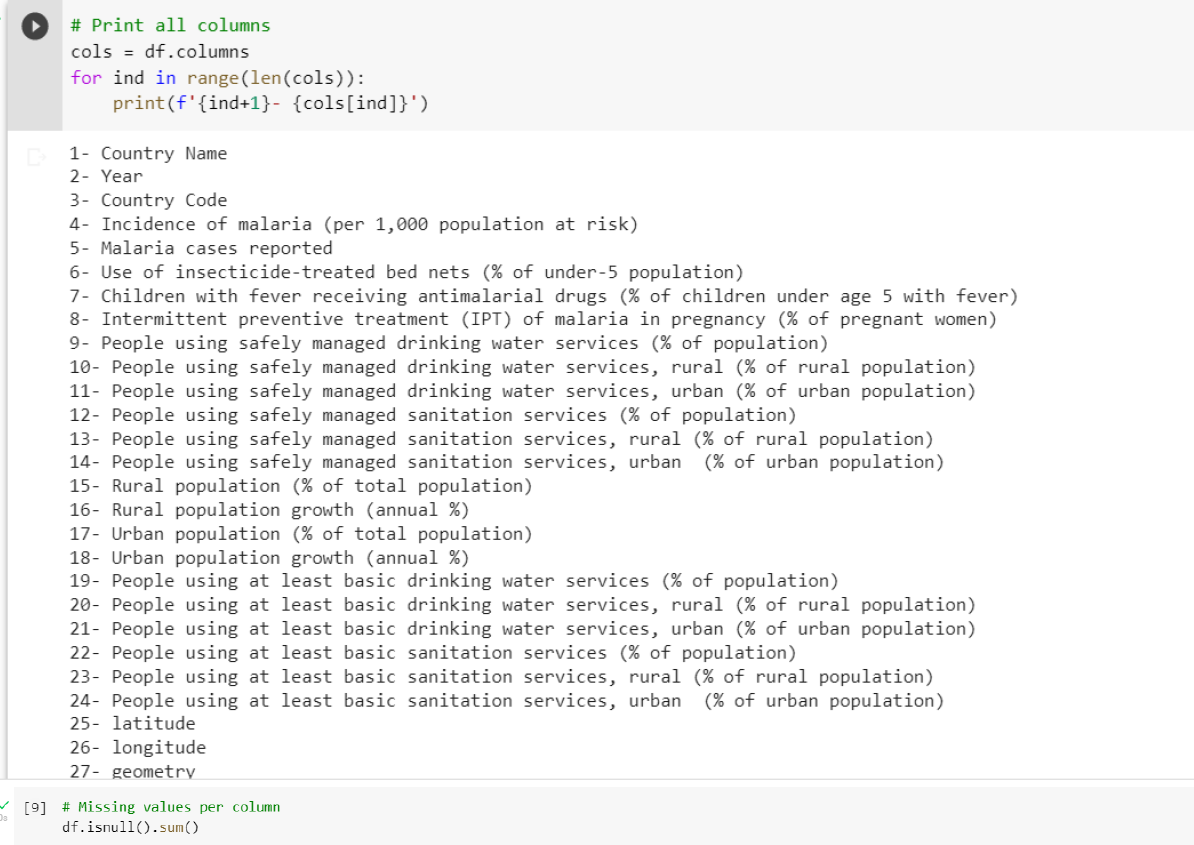
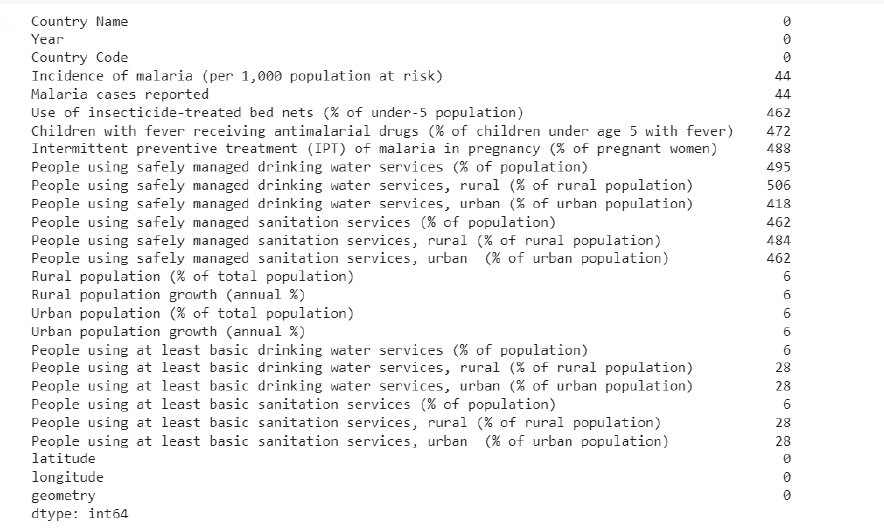
• Contain 594 rows and 27 columns
TOOLS:
Language: Python
Libraries: numpy, pandas, matplotlib, seaborn etc…
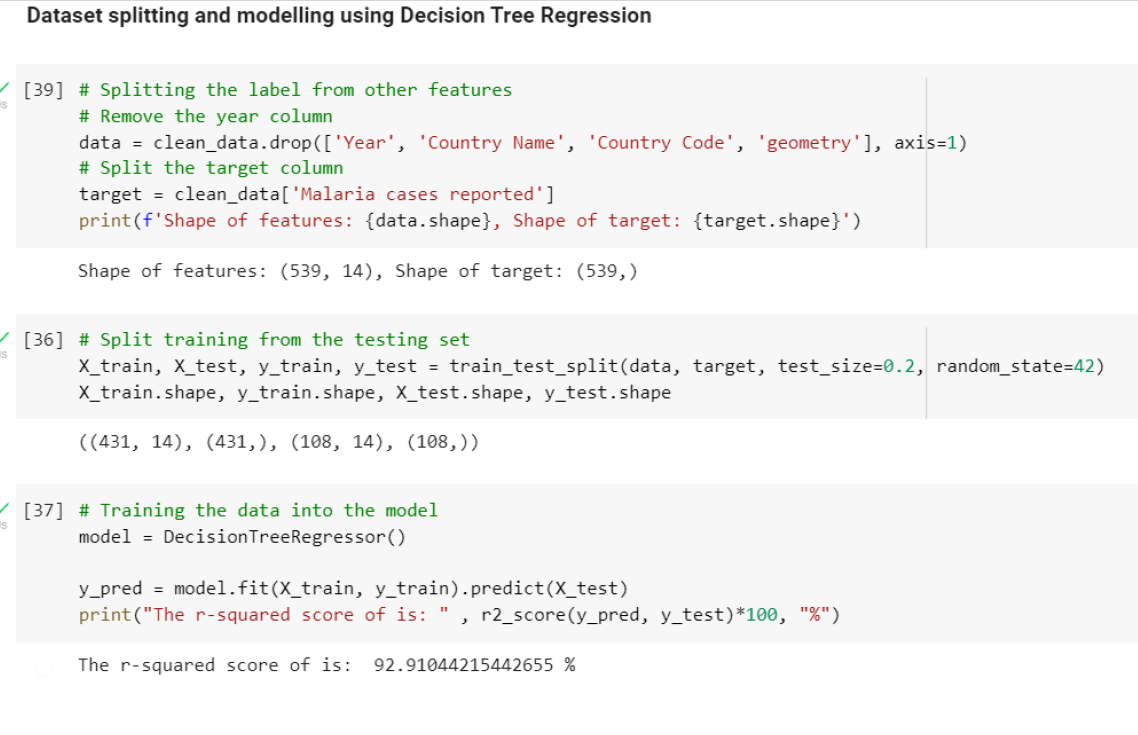
RESULT:
Got an accuracy of 92.91% using decision tree regressor.
